50 Important Social Media Statistics Every Social Media Marketer Should Know

If you want to make the most of your social media campaigns, it’s worthwhile to understand what makes these platforms work, how and why your audiences use them, and what’s in store for marketers in 2022. Here’s all you need to know for the most important and up-to-date social media statistics.
1.As of April 2022, there are 4.65 billion social media users around the world today. That’s 58.7 percent of the total global population.
2. Worldwide, people spend an average of 2 hours and 29 minutes per day on social media.
3. The average person bounces between seven different social networks per month.
4. Shoppers are six times more likely to make a purchase from a product page that includes pictures from social media.
5. 77% of B2B and B2C marketers say that they use retargeting ads as part of their Facebook and Instagram advertising strategies.
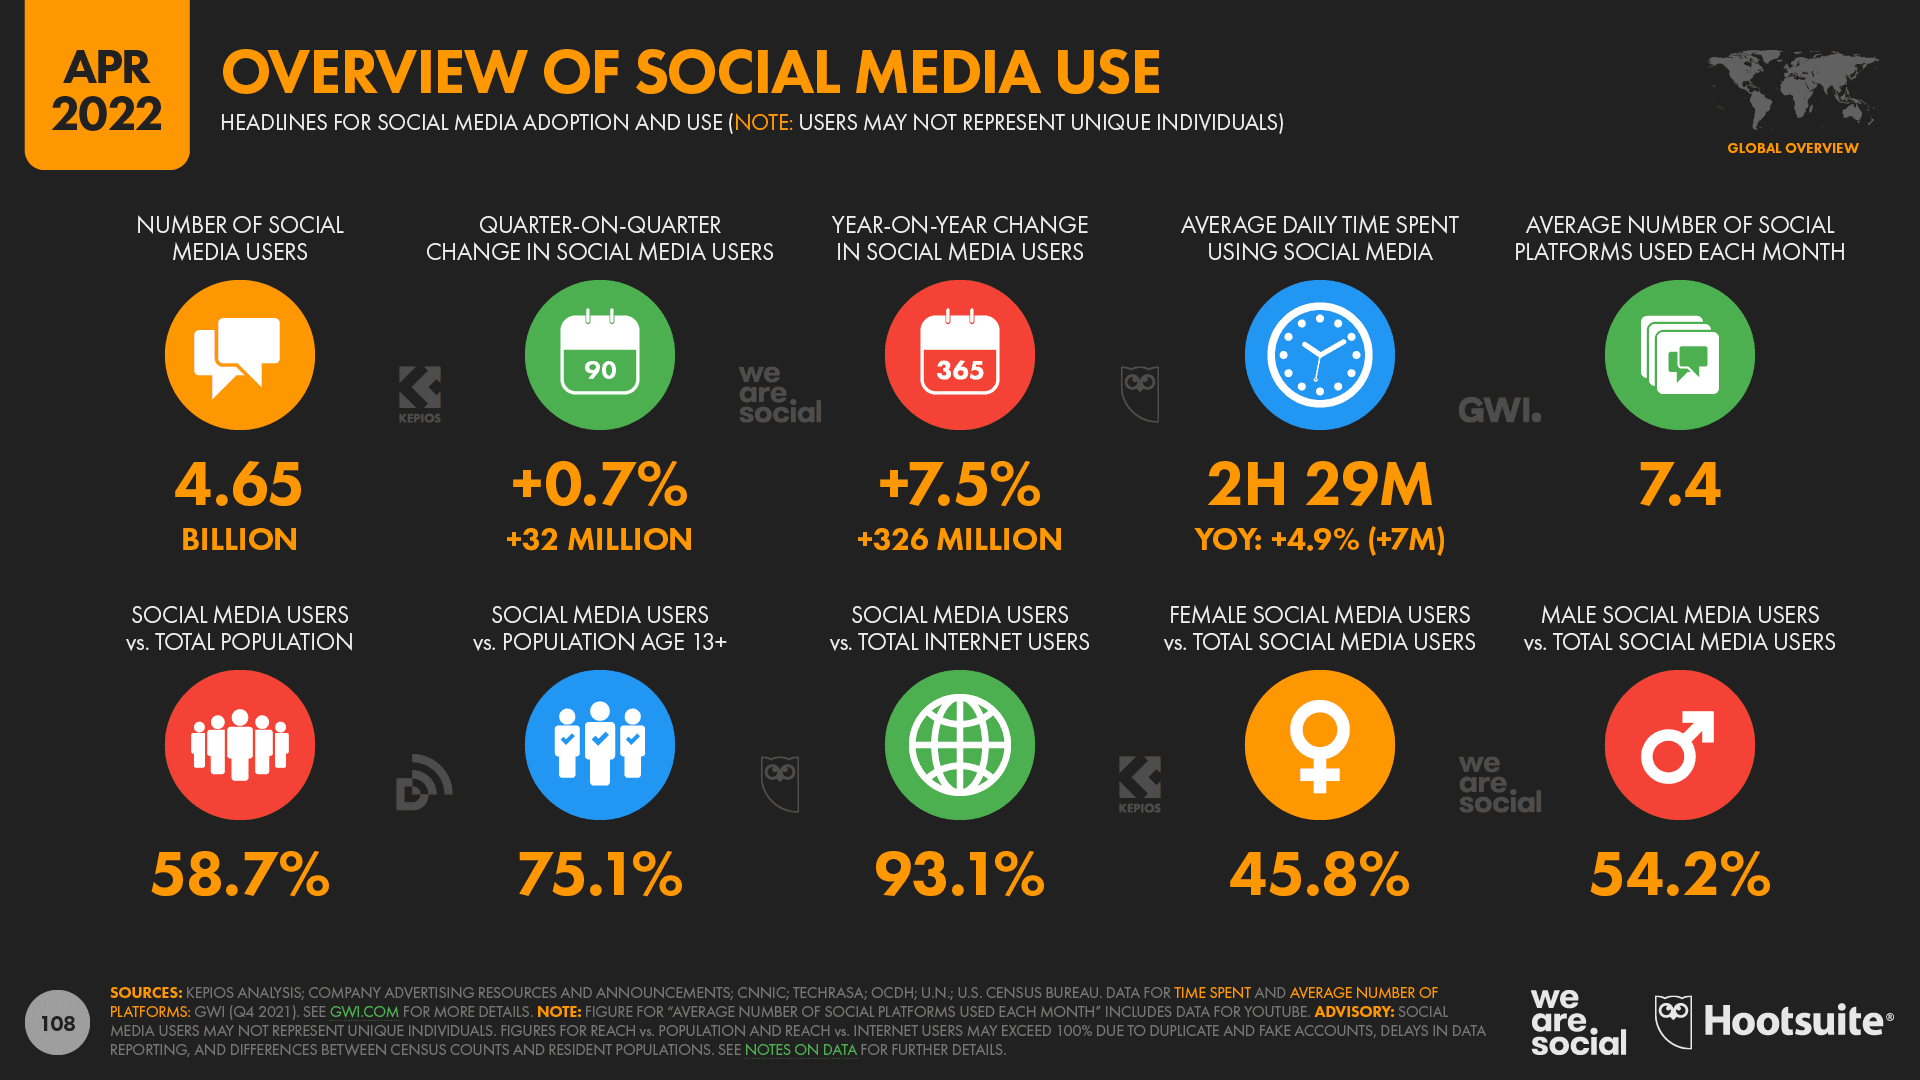
Source: DataReportal
6. 7 in 10 Facebook users say that they use the platform to communicate with friends and family.
7. Facebook is the most-used social media platform by marketers worldwide (93%) followed by Instagram (78%).
8. Facebook remains the market leader with over 2.89 billion monthly active users and it’s on track to reach 3 billion over the course of 2022.
9. In Q3 of 2020, Facebook stated that 10 million active advertisers were using the platform to promote their products and services, compared to 7 million advertisers in the previous year.
10. People are 53% more likely to buy from a business using live chat.
11. 50% of consumers want to discover new products through Facebook Stories. 58% of consumers say that they’ve visited a brand’s website from a Story ad and 31% have browsed a Facebook Shop.
12. Almost 7 in 10 (69.9%) Instagram users say that they publish photos and videos to Instagram, compared to 1 in 3 (33.9%) TikTok users who say that they post videos to TikTok.
13. In Instagram’s 2022 Trend report, 83%of the Gen Z surveyed believe that creators have as much influence as online influencers.
14. The use of #ad tags on Instagram has decreased by 17% over the past year, hinting a change in influencer strategies on the platform.
15. According to a 2020 Instagram Trends Research Study, 44% of people surveyed use Instagram to shop weekly, and 28% of their shopping activities on Instagram are planned.
16. About 1 in 2 people surveyed have used Instagram to discover new brands, products, or services – the best way to do that is by creating collections to help them find the right information and products for them!
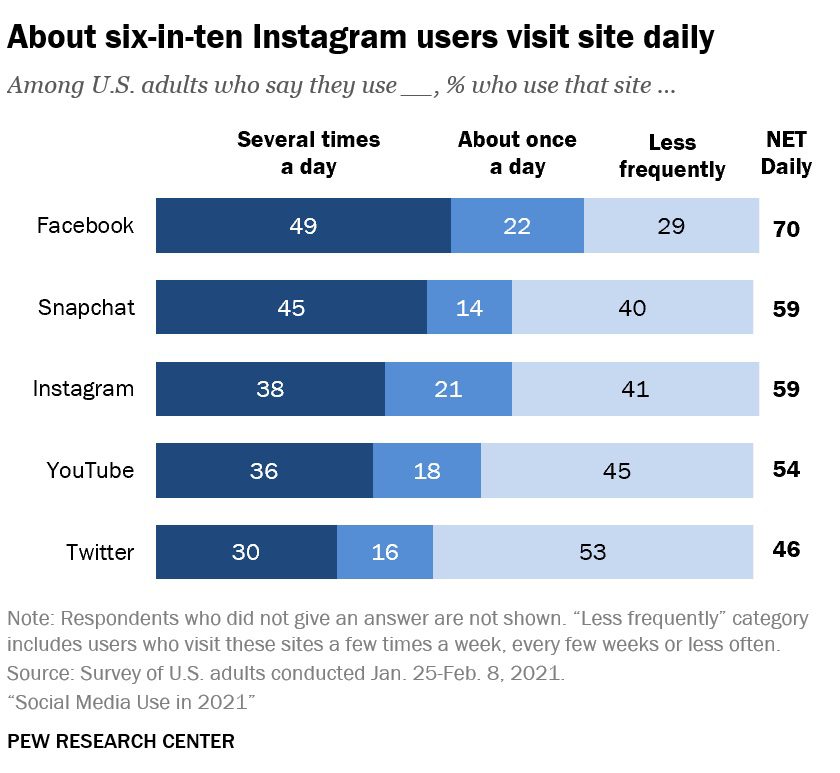
Source: Pew Research Center
17. As of April 2022, 17.1% of global active Instagram users were men between the ages of 25 and 34 years old. More than half of the global Instagram population worldwide is aged 34 years or younger.
18. Pew Research report found around 60% of US adults log in to the app daily.
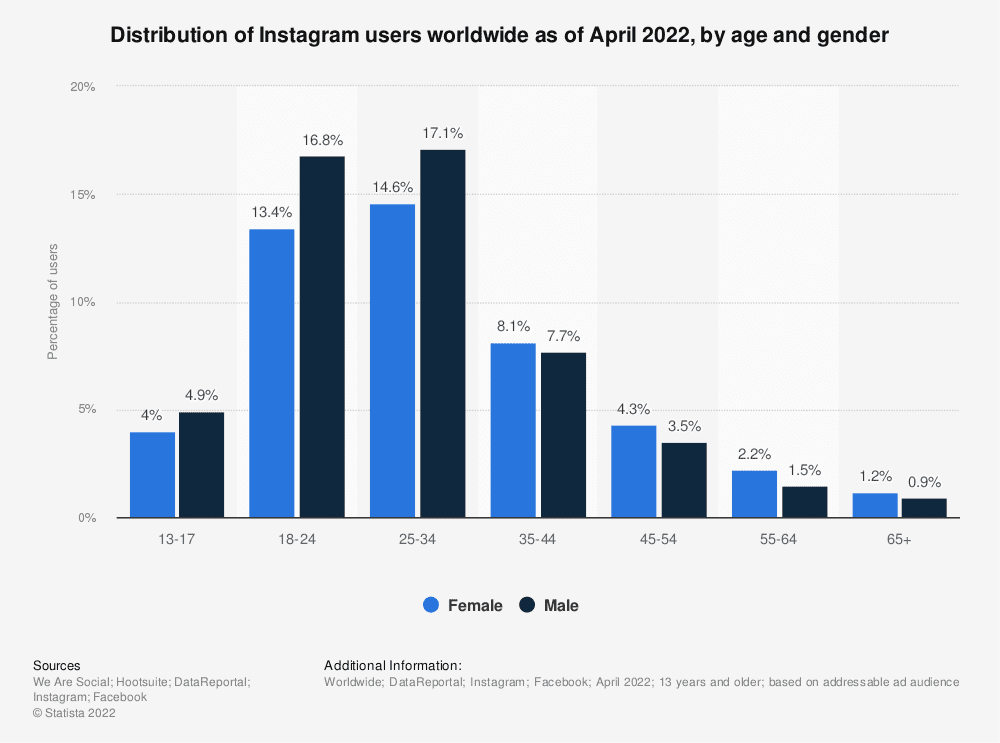
Source: Statista
19. 50% of Instagram users have visited a website to buy a product or service as a result of seeing it in Stories.
20. 90% of Instagram users follow a business on the platform.
21. Instagram engagement rates fell by about 30% this year.
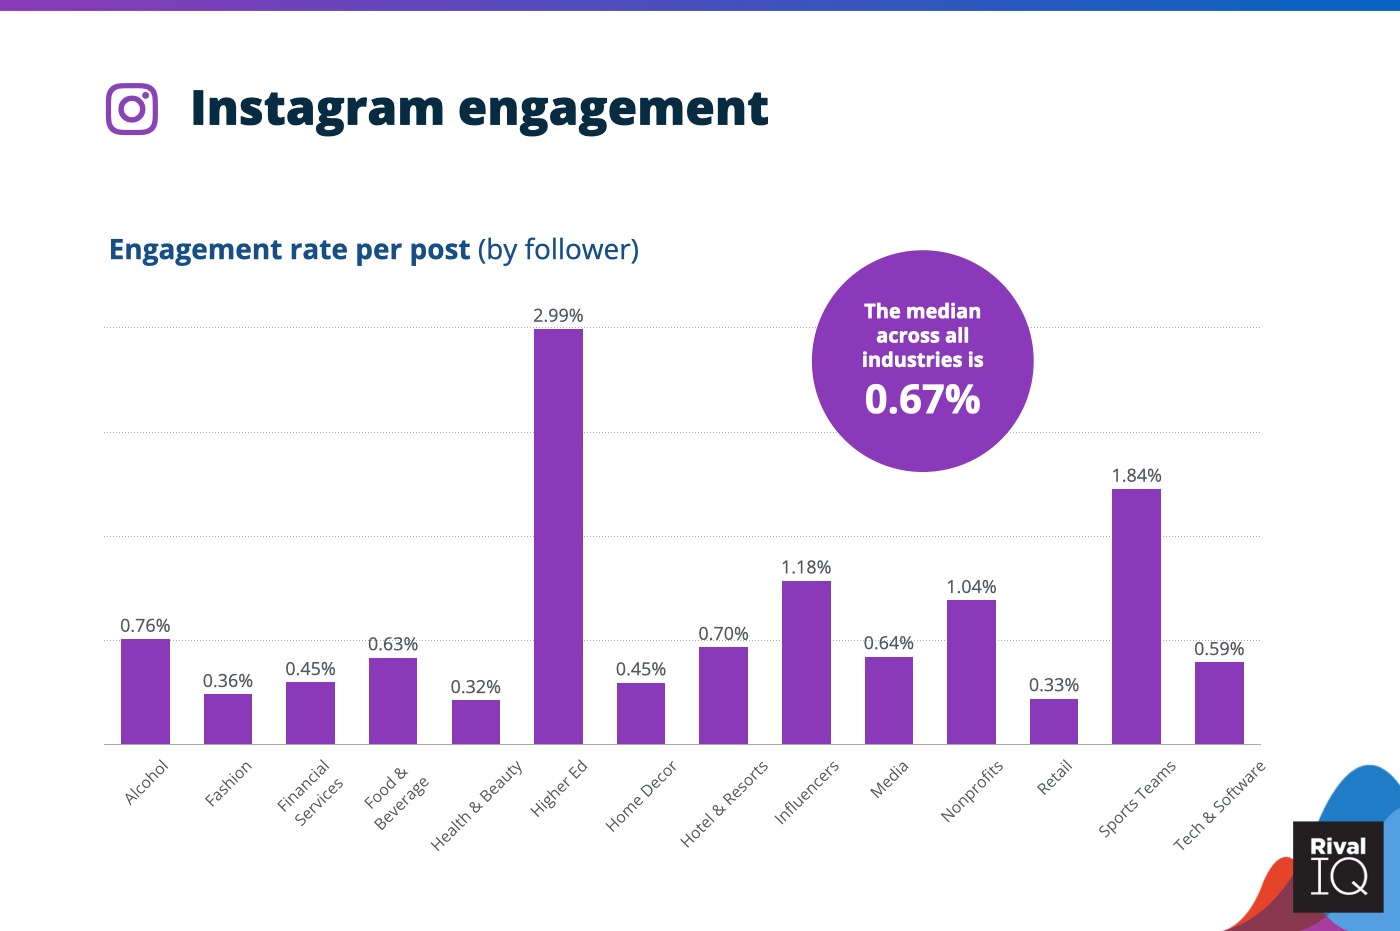
Source: RivalIQ
22. LinkedIn (and Twitter) are the top platforms to stay up to date with news and current events.
23. Over 830 million people in 200 countries and regions use LinkedIn worldwide.
24. APAC region makes up the most of their global users membership with over 230 million users.
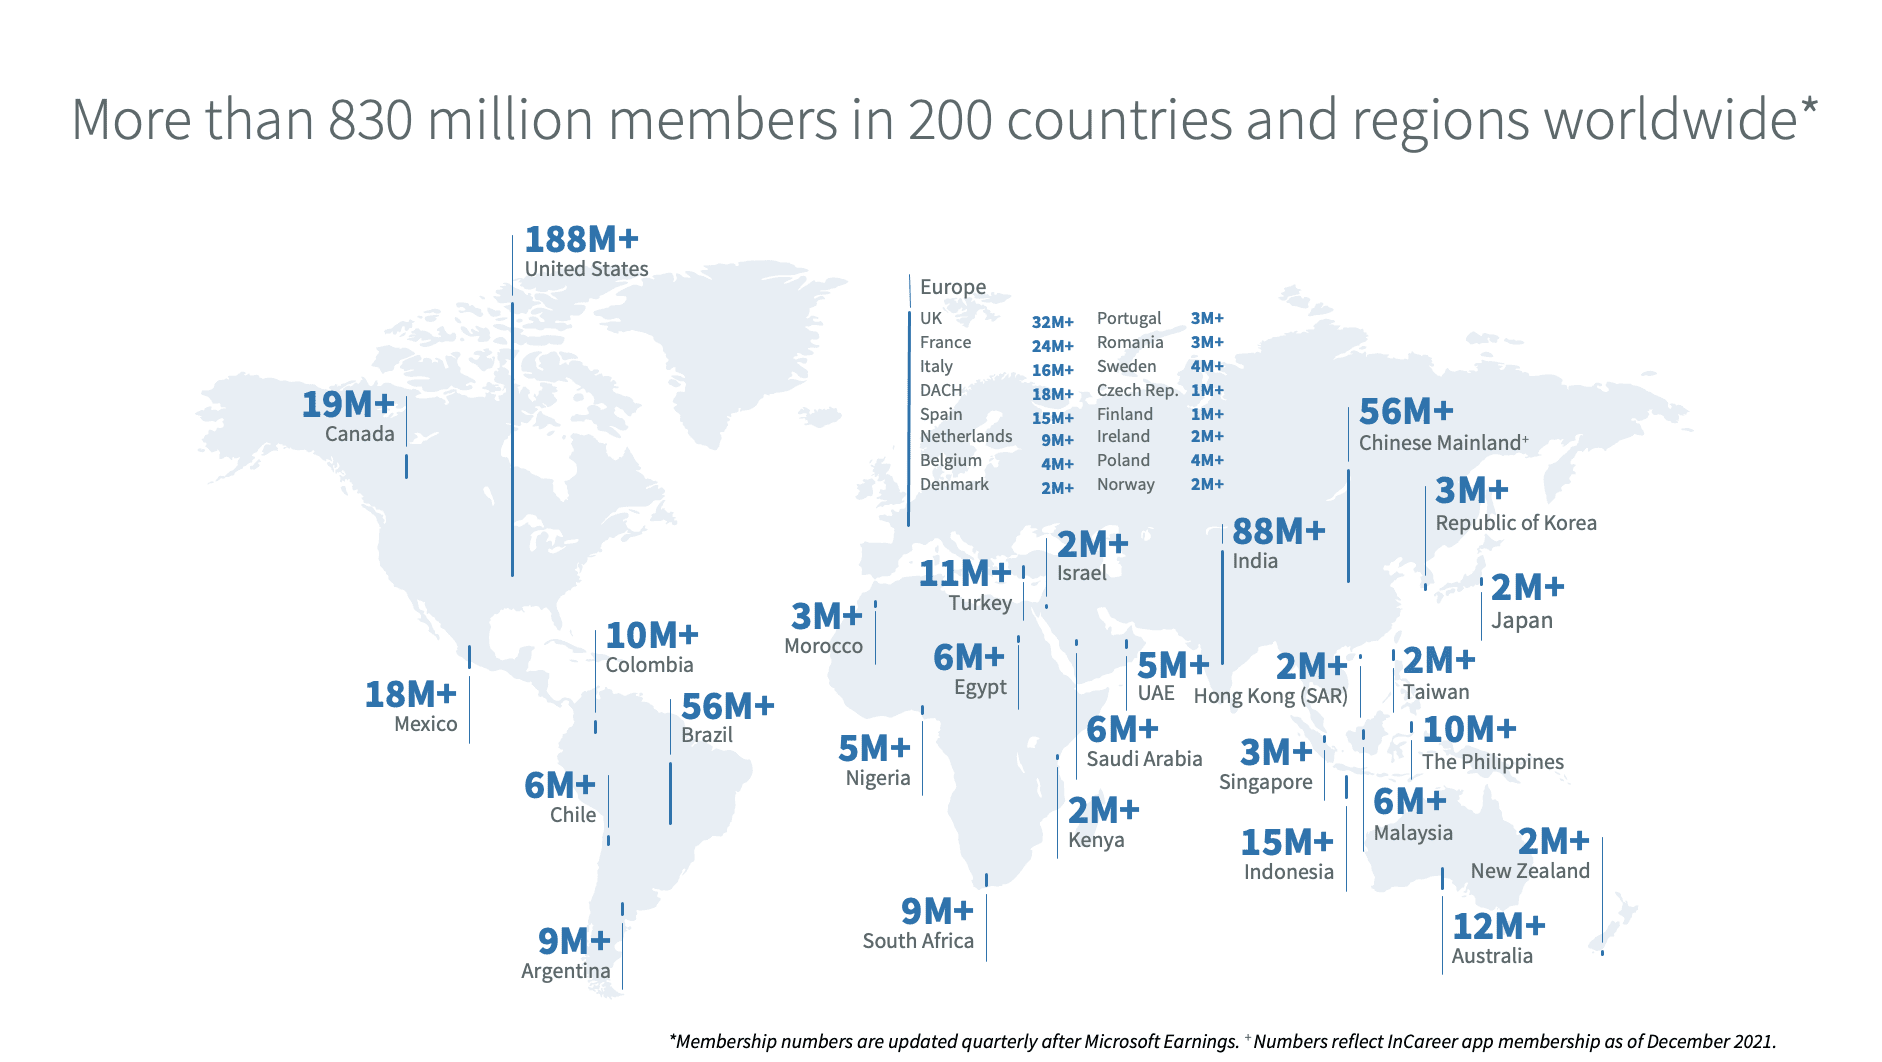
Source: LinkedIn
25. The primary reason LinkedIn users are active on the platform is for job recruitment. There are over 50 million people searching for jobs on LinkedIn every week.
26. 75% of B2B content marketers use LinkedIn ads.
27. 77% of content marketers say LinkedIn produces the best organic results.
28. As of April 2022, Pinterest has 433 million monthly active users and over 240 billion pins saved in total). 433 million people use Pinterest every month to find ideas or inspiration.
29. 37.9% of the platform’s users say that they use Pinterest to follow or research brands.
30. Roughly 5.5% of the world population use Pinterest today.
31. Shoppers on Pinterest have 30% bigger baskets than shoppers on other platforms and they spend twice as much per month.
32. Pinterest’s advertising audience data shows that 76.9% of global users are female, 15.2% are male, and 7.9% are of ‘unspecified’ gender.
33. According to the platform, they said that 7 in 10 pinners say that Pinterest is their go-to for finding new products, ideas, or services they can trust.
34. Weekly pinners are seven times more likely to say Pinterest is the most influential platform in their purchasing journey.
35. According to GWI’s data, 77% of the platform’s users say that they use TikTok to look for funny and entertaining content.
36. TikTok has 1 billion monthly active users.
37. TikTok becomes the first non-Facebook mobile app to reach 3 billion downloads globally.
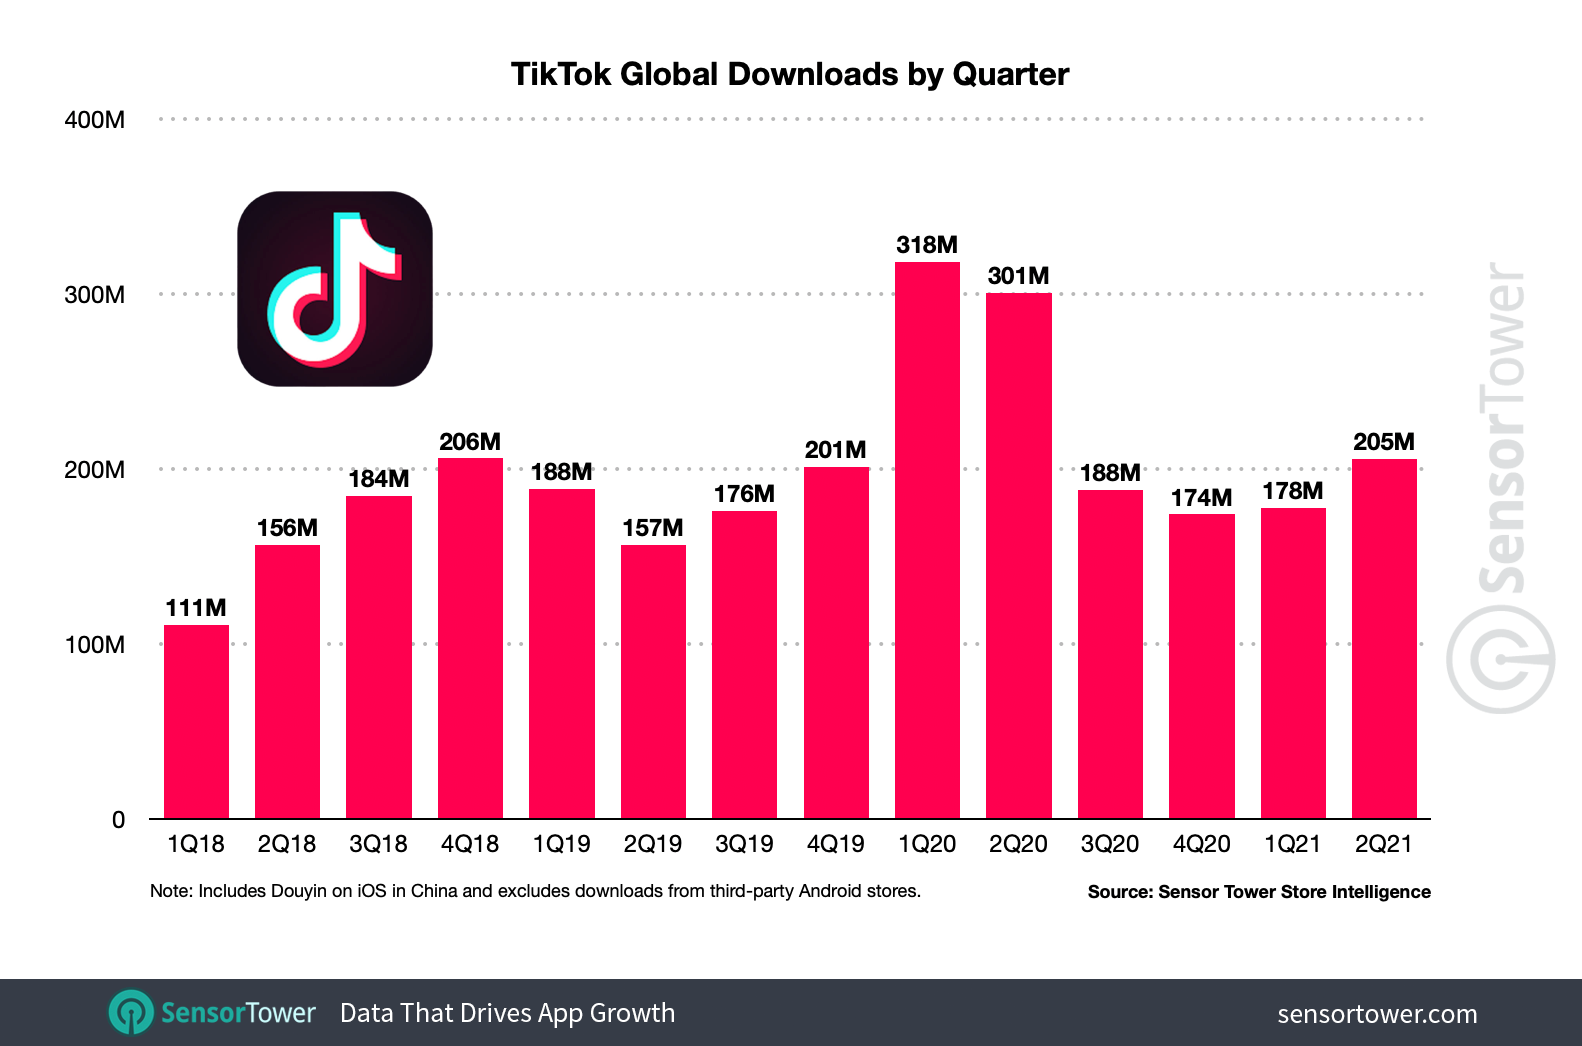
Source: Sensor Tower
38. TikTok posts tagged with #FYP (“for you page”) have now delivered a combined total of more than 22.5 trillion views. (Source: Kepios analysis of data published on TikTok.com).
39. TikTok has grown highly popular in most Asian countries, in Indonesia (87.5 million users), Vietnam (39.7% million), Thailand (35.6 million), and the Philippines (33 million).
40. TikTok was the second fastest growing brand of 2020, behind Zoom, for Gen Z and Millennials.
41. 39% of Gen Zers surveyed say they are most likely to buy a product they learned about on TikTok videos.
42. TikTok-specific branded content is more engaging, resulting in higher view rates.
43. In the United States, 52% of Twitter users use the platform daily, 84% use it daily, whilst 96% claimed they use it monthly.
44. The platform boasts 436 million monthly active users in total worldwide.
45. Tweeting frequency rose about 13% in 2022.
46. As of January 2022, Twitter is more likely to be used by men (56.4%) compared to women (43.6%).
47. People spend 26% more time viewing ads on Twitter than on other leading platforms.
48. Almost half of Twitter’s audience consume news regularly on the platform.
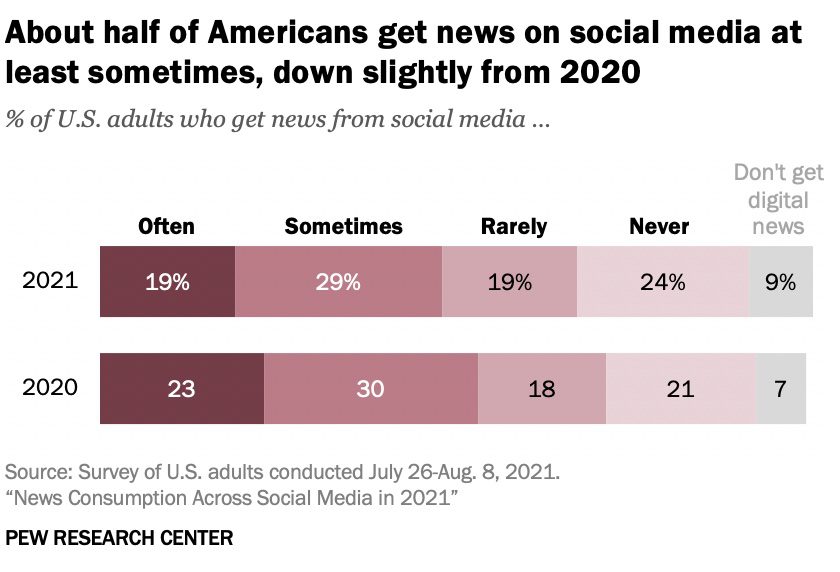
Source: Pew Research Center
49. 16% of internet users aged 16-64 use Twitter for brand research.
50. 77% of Twitter users feel more positive about brands that are community and society focused.
Did any of these stats stand out to you?
Learning from them is key to fine-tuning your strategy and setting smarter social media marketing goals. Brands need to stay ahead of the game with the latest stats and trends to remain relevant.
Are you looking to build a better social media marketing strategy? We’re here to help. Get in touch with us at hello@medianetic.me, or drop us a message via our chatbot below! We look forward to partnering with you.


Medianetic Sdn Bhd
200301016995 (619415-K)
No. 59, 2nd Floor, Block E, Zenith Corporate Park, Jalan SS7/26 Kelana Jaya, 47301 Petaling Jaya, Selangor
hello@medianetic.me
+603 7960 3088 (Office)
Medianetic Sdn Bhd © 2023
Made by Medianetic